ThinkPad:Benchmarking: Difference between revisions
From Wiki³
(→hdparm) |
|||
| Line 12: | Line 12: | ||
{{Console|1=sudo hdparm -Tt /dev/sda}}<br/> | {{Console|1=sudo hdparm -Tt /dev/sda}}<br/> | ||
{{Console|/dev/sda:<br/> Timing cached reads: 12822 MB in 2.00 seconds {{=}} 6414.67 MB/sec<br/> Timing buffered disk reads: 790 MB in 3.00 seconds {{=}} 263.13 MB/sec|prompt=false}} | {{Console|/dev/sda:<br/> Timing cached reads: 12822 MB in 2.00 seconds {{=}} 6414.67 MB/sec<br/> Timing buffered disk reads: 790 MB in 3.00 seconds {{=}} 263.13 MB/sec|prompt=false}} | ||
=== systemd-analyze === | |||
This plot is a detailed graphic of the boot sequence. | |||
{{Console|1=systemd-analyze plot ~/boot.svg}} | |||
[[File:ThinkPad X220 Boot Analysis.svg|570px]] | |||
[[Category:ThinkPad]] | [[Category:ThinkPad]] | ||
Revision as of 23:33, 16 July 2017
| UNDER CONSTRUCTION: The document is currently being modified! |
Test Results
For testing I installed the following packages.
| # yaourt -S mesa-demos hdparm |
glxgears
| # glxgears |
| Running synchronized to the vertical refresh. The framerate should be approximately the same as the monitor refresh rate. 304 frames in 5.0 seconds = 60.715 FPS 301 frames in 5.0 seconds = 60.049 FPS 301 frames in 5.0 seconds = 60.050 FPS 301 frames in 5.0 seconds = 60.050 FPS 301 frames in 5.0 seconds = 60.048 FPS 301 frames in 5.0 seconds = 60.049 FPS 301 frames in 5.0 seconds = 60.050 FPS 301 frames in 5.0 seconds = 60.048 FPS 301 frames in 5.0 seconds = 60.050 FPS 301 frames in 5.0 seconds = 60.048 FPS 301 frames in 5.0 seconds = 60.045 FPS 301 frames in 5.0 seconds = 60.055 FPS 301 frames in 5.0 seconds = 60.049 FPS 301 frames in 5.0 seconds = 60.049 FPS |
hdparm
| # sudo hdparm -Tt /dev/sda |
| /dev/sda: Timing cached reads: 12822 MB in 2.00 seconds = 6414.67 MB/sec Timing buffered disk reads: 790 MB in 3.00 seconds = 263.13 MB/sec |
systemd-analyze
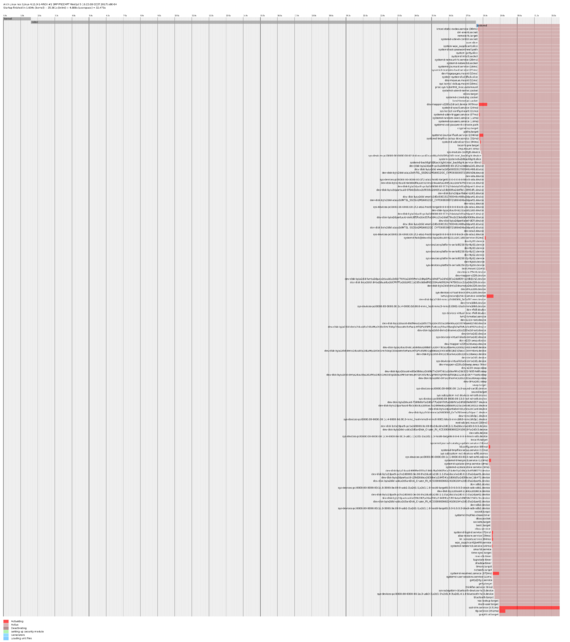
This plot is a detailed graphic of the boot sequence.
| # systemd-analyze plot ~/boot.svg |
