ThinkPad X220: Benchmarking
From Wiki³
| UNDER CONSTRUCTION: The document is currently being modified! |
Basic Tests
For basic testing I installed the following packages.
| # yaourt -S mesa-demos hdparm |
dd (cpu)
Using dd in conjunction with any steam-processing CPU-intensive program to provide a simple CPU benchmark. It may not be very accurate though.
| # dd if=/dev/zero bs=1G count=10 | md5sum |
| 10+0 records in 10+0 records out 10737418240 bytes (11 GB, 10 GiB) copied, 20.3283 s, 528 MB/s 2dd26c4d4799ebd29fa31e48d49e8e53 - |
| CPU Temperature peaked around 64C during the test. |
I then performed a rough 5 minute test.
| # dd if=/dev/zero bs=1G count=160 | md5sum |
| 160+0 records in 160+0 records out 171798691840 bytes (172 GB, 160 GiB) copied, 324.407 s, 530 MB/s 8f75e24931ccd52edfc887601023073b - |
| CPU Temperature was a constant ~70C with peaks of 71-72C hitting as high as 74C near the end. |
dd (ssd write)
| # dd if=/dev/zero of=$HOME/tempfile bs=1M count=1024 conv=fdatasync,notrunc status=progress |
| 1024+0 records in 1024+0 records out 1073741824 bytes (1.1 GB, 1.0 GiB) copied, 9.93576 s, 108 MB/s |
glxgears (vsync)
| # glxgears |
| Running synchronized to the vertical refresh. The framerate should be approximately the same as the monitor refresh rate. 304 frames in 5.0 seconds = 60.715 FPS 301 frames in 5.0 seconds = 60.049 FPS 301 frames in 5.0 seconds = 60.050 FPS 301 frames in 5.0 seconds = 60.050 FPS 301 frames in 5.0 seconds = 60.048 FPS 301 frames in 5.0 seconds = 60.049 FPS 301 frames in 5.0 seconds = 60.050 FPS 301 frames in 5.0 seconds = 60.048 FPS 301 frames in 5.0 seconds = 60.050 FPS 301 frames in 5.0 seconds = 60.048 FPS 301 frames in 5.0 seconds = 60.045 FPS 301 frames in 5.0 seconds = 60.055 FPS 301 frames in 5.0 seconds = 60.049 FPS 301 frames in 5.0 seconds = 60.049 FPS |
hdparm (ssd read)
| # sudo hdparm -Tt /dev/sda |
| /dev/sda: Timing cached reads: 12822 MB in 2.00 seconds = 6414.67 MB/sec Timing buffered disk reads: 790 MB in 3.00 seconds = 263.13 MB/sec |
systemd-analyze (boot speed)
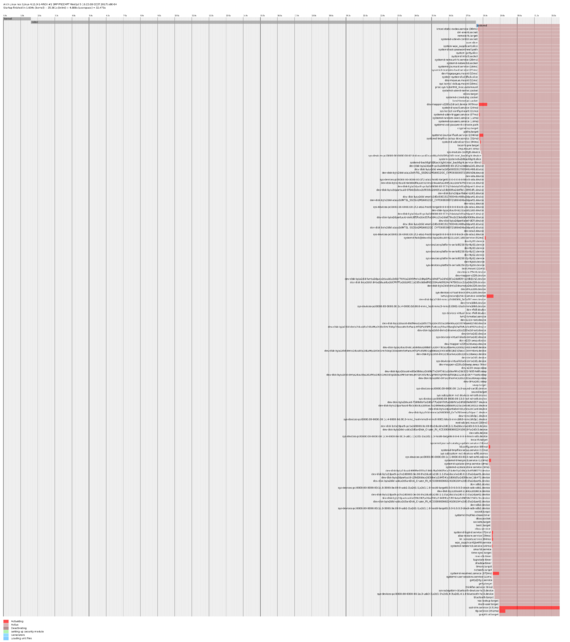
This plot is a detailed graphic of the boot sequence.
| # systemd-analyze plot ~/boot.svg |
unixbench
BYTE UNIX Benchmarks (Version 5.1.3)
https://github.com/kdlucas/byte-unixbench
| System: | noc: GNU/Linux |
| OS: | GNU/Linux -- 4.11.9-1-ARCH -- #1 SMP PREEMPT Wed Jul 5 18:23:08 CEST 2017 |
| Machine: | x86_64: unknown |
| Language: | en_US.utf8 (charmap="UTF-8", collate="ANSI_X3.4-1968") |
| CPUs: | Intel(R) Core(TM) i7-2640M CPU @ 2.80GHz (5584.6/5586.7/5585.0/5585.1 bogomips) Hyper-Threading, x86-64, MMX, Physical Address Ext, SYSENTER/SYSEXIT, SYSCALL/SYSRET, Intel Virtualization |
| Uptime: | 11:07:16 up 0 min, 1 user, load average: 0.29, 0.08, 0.02; runlevel unknown |
