ThinkPad X220: Benchmarking
From Wiki³
| UNDER CONSTRUCTION: The document is currently being modified! |
Test Results
For testing I installed the following packages.
| # yaourt -S mesa-demos hdparm |
dd (ssd write)
| # dd if=/dev/zero of=$HOME/tempfile bs=1M count=1024 conv=fdatasync,notrunc status=progress |
glxgears (vsync)
| # glxgears |
| Running synchronized to the vertical refresh. The framerate should be approximately the same as the monitor refresh rate. 304 frames in 5.0 seconds = 60.715 FPS 301 frames in 5.0 seconds = 60.049 FPS 301 frames in 5.0 seconds = 60.050 FPS 301 frames in 5.0 seconds = 60.050 FPS 301 frames in 5.0 seconds = 60.048 FPS 301 frames in 5.0 seconds = 60.049 FPS 301 frames in 5.0 seconds = 60.050 FPS 301 frames in 5.0 seconds = 60.048 FPS 301 frames in 5.0 seconds = 60.050 FPS 301 frames in 5.0 seconds = 60.048 FPS 301 frames in 5.0 seconds = 60.045 FPS 301 frames in 5.0 seconds = 60.055 FPS 301 frames in 5.0 seconds = 60.049 FPS 301 frames in 5.0 seconds = 60.049 FPS |
hdparm (ssd read)
| # sudo hdparm -Tt /dev/sda |
| /dev/sda: Timing cached reads: 12822 MB in 2.00 seconds = 6414.67 MB/sec Timing buffered disk reads: 790 MB in 3.00 seconds = 263.13 MB/sec |
systemd-analyze (boot speed)
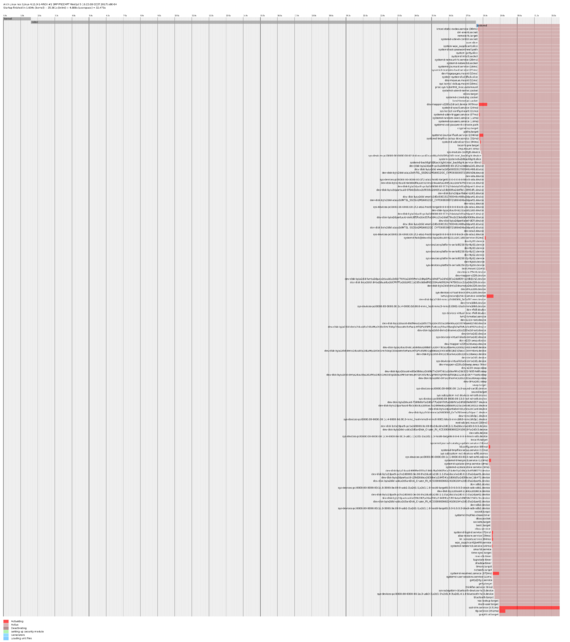
This plot is a detailed graphic of the boot sequence.
| # systemd-analyze plot ~/boot.svg |
