ThinkPad X220: Benchmarking
From Wiki³
| UNDER CONSTRUCTION: The document is currently being modified! |
Basic Tests
For basic testing I installed the following packages.
| # yaourt -S mesa-demos hdparm |
dd (cpu)
Using dd in conjunction with any steam-processing CPU-intensive program to provide a simple CPU benchmark. It may not be very accurate though.
| # dd if=/dev/zero bs=1G count=10 | md5sum |
| 10+0 records in 10+0 records out 10737418240 bytes (11 GB, 10 GiB) copied, 20.3283 s, 528 MB/s 2dd26c4d4799ebd29fa31e48d49e8e53 - |
| CPU Temperature peaked around 64C during the test. |
I then performed a rough 5 minute test.
| # dd if=/dev/zero bs=1G count=160 | md5sum |
| 160+0 records in 160+0 records out 171798691840 bytes (172 GB, 160 GiB) copied, 324.407 s, 530 MB/s 8f75e24931ccd52edfc887601023073b - |
| CPU Temperature was a constant ~70C with peaks of 71-72C hitting as high as 74C near the end. |
dd (ssd write)
| # dd if=/dev/zero of=$HOME/tempfile bs=1M count=1024 conv=fdatasync,notrunc status=progress |
| 1024+0 records in 1024+0 records out 1073741824 bytes (1.1 GB, 1.0 GiB) copied, 9.93576 s, 108 MB/s |
glxgears (vsync)
| # glxgears |
| Running synchronized to the vertical refresh. The framerate should be approximately the same as the monitor refresh rate. 304 frames in 5.0 seconds = 60.715 FPS 301 frames in 5.0 seconds = 60.049 FPS 301 frames in 5.0 seconds = 60.050 FPS 301 frames in 5.0 seconds = 60.050 FPS 301 frames in 5.0 seconds = 60.048 FPS 301 frames in 5.0 seconds = 60.049 FPS 301 frames in 5.0 seconds = 60.050 FPS 301 frames in 5.0 seconds = 60.048 FPS 301 frames in 5.0 seconds = 60.050 FPS 301 frames in 5.0 seconds = 60.048 FPS 301 frames in 5.0 seconds = 60.045 FPS 301 frames in 5.0 seconds = 60.055 FPS 301 frames in 5.0 seconds = 60.049 FPS 301 frames in 5.0 seconds = 60.049 FPS |
hdparm (ssd read)
| # sudo hdparm -Tt /dev/sda |
| /dev/sda: Timing cached reads: 12822 MB in 2.00 seconds = 6414.67 MB/sec Timing buffered disk reads: 790 MB in 3.00 seconds = 263.13 MB/sec |
systemd-analyze (boot speed)
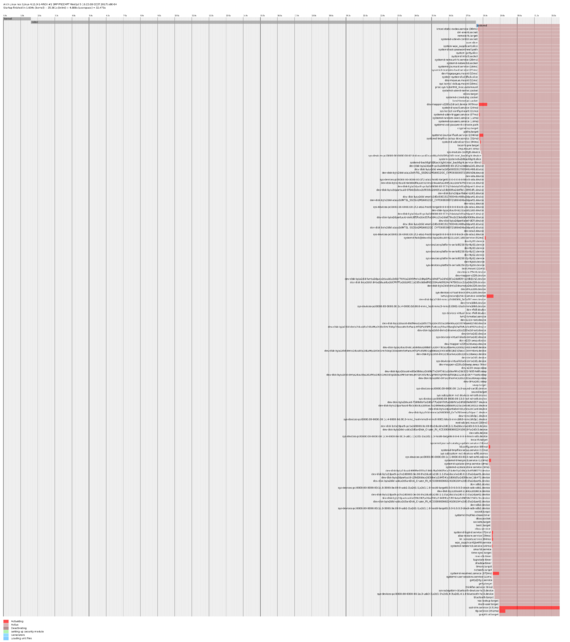
This plot is a detailed graphic of the boot sequence.
| # systemd-analyze plot ~/boot.svg |
Phoronix Test Suite
I was originally going to do extensive testing with the Phoronix Test Suite on my ThinkPad X220 until about 60% of the tests failed on Arch Linux.
System Information
| # phoronix-test-suite system-info |
| Phoronix Test Suite v7.2.0 System Information PROCESSOR: Intel Core i7-2640M @ 3.50GHz (4 Cores) Core Count: 2 Thread Count: 4 Extensions: SSE 4.2 + AVX Cache Size: 4096 KB Microcode: 0x29 Scaling Driver: intel_pstate powersave GRAPHICS: Intel HD 3000 (1300MHz) Display Driver: intel 2.99.917 Screen: 1366x768 MOTHERBOARD: LENOVO 42901Z2 Memory: 8192MB Chipset: Intel 2nd Generation Core Family DRAM Network: Intel 82579LM Gigabit Connection + Intel Centrino Advanced-N 6205 DISK: 160GB INTEL SSDSA2M160 File-System: ext4 Mount Options: data=ordered relatime rw Disk Scheduler: CFQ OPERATING SYSTEM: Arch Linux Kernel: 4.11.9-1-ARCH (x86_64) Compiler: GCC 7.1.1 20170630 + Clang 4.0.1 |
